Detection as Code: A Maturity Framework
Detection as Code (DaC) is transforming how we handle threat detection by merging software engineering practices with security operations. Breaking down DaC into functional areas can enhance your organization's detection capabilities and maturity.

Detection as Code: A Maturity Framework
Introduction
In the ever-evolving landscape of cybersecurity, the methodologies and tools we rely on are continually advancing. One of the latest trends is Detection as Code (DaC), which promises to revolutionize threat detection by integrating software engineering practices into security operations. Having worked in an organization that practices DaC for several years, I’ve come to realize that it’s not simply a matter of whether or not to adopt DaC.
If we want to adopt DaC, where do we start? And how do we know if we’re doing a good job at it? How do I convince leadership that it’s an area we should invest in? At Snowflake, we’ve been executing on aspects of DaC long before I arrived. However, we quickly learned that writing our detections in an IDE wasn’t sufficient to achieve the operational results we wanted. Like most principles in cybersecurity, DaC can be broken down into multiple functional areas, each with its own levels of maturity. I’ll share my insights into these functional areas, the various maturity levels within them, and how to improve your competency in each area.
Understanding Detection as Code
Detection as Code (DaC) leverages automation and version control to manage, deploy, and maintain detection rules, policies, and configurations. By treating detection rules as code, DaC enables rigorous testing, continuous integration/continuous deployment (CI/CD), and monitoring practices to enhance the reliability and efficiency of threat detection. A key aspect of DaC isn’t just writing detections in YAML or Python, but also applying the same development and deployment rigor as software engineers.
Functional Areas and Maturity Levels
DaC can be divided into four functional areas: programming language, testing, integration & automation, and monitoring. Each area has four maturity levels: Ad hoc, structured, automated, and optimized. Let’s explore each area in detail.
Programming Language
The choice of language for defining detections significantly impacts capabilities. Languages vary in flexibility and tools for translating ideas into code. Many teams start with markup languages, such as YAML. YAML has almost no barrier to entry and is extremely human readable.
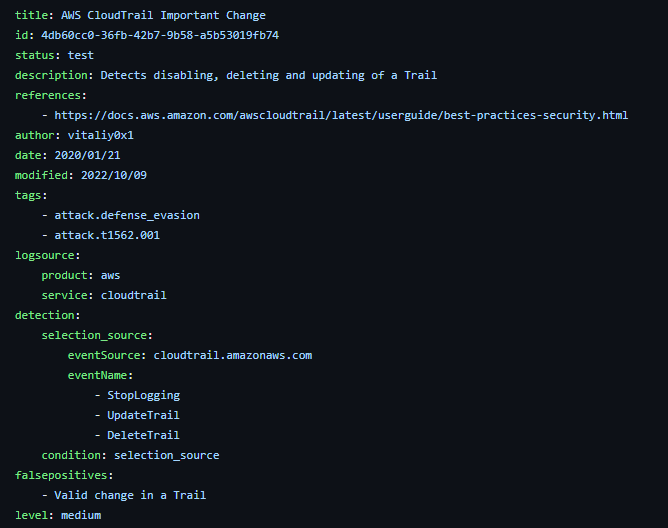
Image Source: https://github.com/SigmaHQ/sigma/blob/master/rules/cloud/aws/cloudtrail/aws_cloudtrail_disable_logging.yml
The Sigma Project is a well-known DaC project focused on YAML. However, expressing complex logical thoughts with YAML can be challenging.
A step up from YAML are query languages such as SQL or SPL. Query languages are specifically designed for analyzing large amounts of systems from databases or other data stores (such as one where you may keep your logs). The SIEM I’m most familiar with that is purely based on using SQL is SnowAlert (a now mostly deprecated project).
General-purpose languages like Python offer the most flexibility in translating detection logic to code. Many modern detection engineering teams are moving towards Python or Go for interfacing with their data due to their flexible structures and rich libraries.
An optimized team uses the best tool for the job, seamlessly integrating markup, query, and functional languages.
Maturity Levels
- Ad hoc: Markup language
- Structured: Query language
- Automated: General-purpose language
- Optimized: Any combination of the above/best tool for the job
Testing
Testing your detections is a critical and sadly often neglected area. I’ve broken down testing into five different areas (unit testing, linting, performance testing, integration testing, and end-to-end), which can seem even more daunting. You may say to yourself “that’s such a huge task, why even bother?” It’s important to realize that significant improvements can be realized with just a modicum of testing.
Unit Testing
Unit testing is focused on ensuring your detection logic is correct that works by passing input to your detection logic and ensuring the output matches as expected.
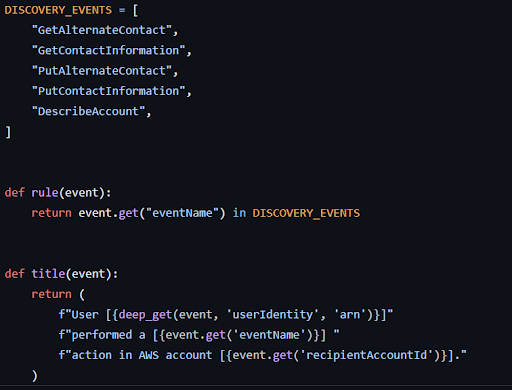
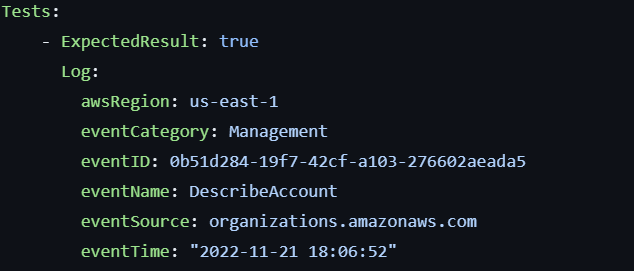
In the above example based on Panther, we pass an example input into our rule along with an expected output.
Linting
Linting is basic static analysis for code quality. Linting can speed up code reviews and ensure highly standardized code even with multiple engineers contributing.
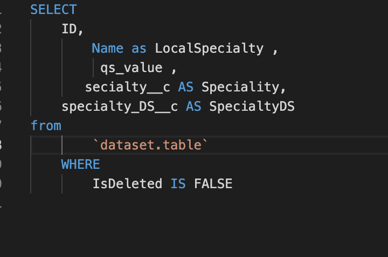
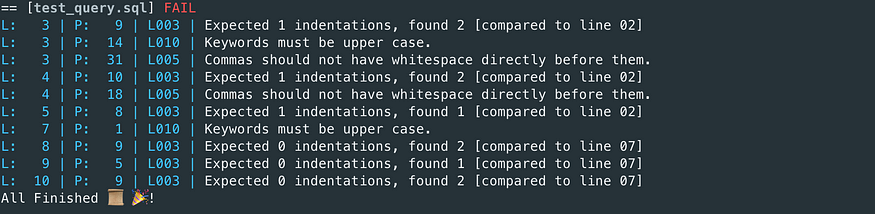
Images source: https://plainenglish.io/blog/how-to-lint-properly-your-sql-code-5ae21e6f9f5c
Performance Testing
Performance testing will run your queries or detections and ensure they run in a timely and cost efficient way.
Integration Testing
Integration testing ensures that disparate systems which interface together properly interface as expected. This is most common when you have other parts of your detection platform such as SOAR.
End-to-End Testing
End-to-end testing occurs when you full test your system from data generation all the way to case management and potentially closure.
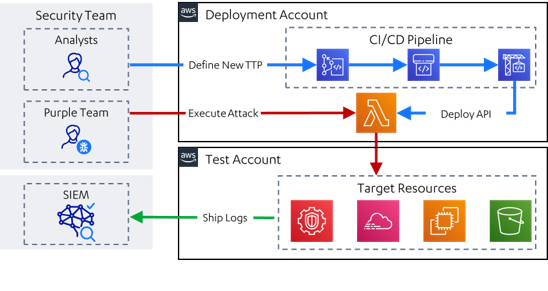
Image Source: https://github.com/WithSecureLabs/leonidas
Testing Priority and Difficulty
Not all testing methodologies are created equal. Some tests are hard to get setup or maybe aren’t a super high priority. For your organization, you should decide on the areas you’re seeing the most operational failures and work to setup testing for those areas. Note that the below difficulty may vary depending on your tech stack and organizational structure.
| Test Type | Priority | Difficulty |
|---|---|---|
| Unit Testing | High | Low |
| Linting | Low | Low |
| Performance | Medium | Medium |
| Integration | Medium | Medium |
| End-To-End | Low | High |
Maturity Levels
- Ad hoc: No or minimal testing
- Structured: Some testing in all areas or strong testing in some areas but missing in others
- Automated: Some testing in all areas with strong capabilities in a few categories. A sandbox/dev environment exists and is used
- Optimized: Appropriate testing for all components with code coverage measurements. Tests required for new detections, with appropriate mechanisms in place (ie. robust criteria and automated expiration) for break-glass scenarios
Automation and Integration
Developing appropriate automation and integrations is critical to improving analyst response time and decrease error likelihood. Anytime your SOC analyst has to context switch, go into another system for information, or look something up, it increases time to respond and adds unnecessary friction. I firmly believe that as detection engineers, our job is to give as much information to the SOC so they can do what they do best: analysis and response. Integrations empower your analyst and therefore should be a top priority for any robust detection team.
Suppression
One of the most common detections is “impossible travel”. When an analyst gets this alert, the first step in their playbook is usually to reach out to the user to confirm that it was in fact them logging into a system. We can use automation to suppress this alert, though.
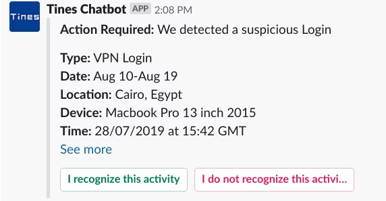
Image Source: https://www.tines.com/blog/chatbots-for-security-and-it-teams-part-3-creating-a-slack-chatbot/
If the user clicks “I recognize this activity” then the alert is closed without further (or any) action needed from the analyst.
Enrichment
Sometimes the data you need doesn’t exist in your logs because maybe it’s too expensive or too infeasible to ingest for whatever reason. In this case, you’ll want integrations that allow you to query real-time data in order to enrich an alert. Looking at the example where one can escalate privileges through EC2 user data, we can see that we can detect this activity through watching CloudTrail for the “ModifyInstanceAttribute” event. However, the actual user data is removed because its very common for secrets to be in this data.
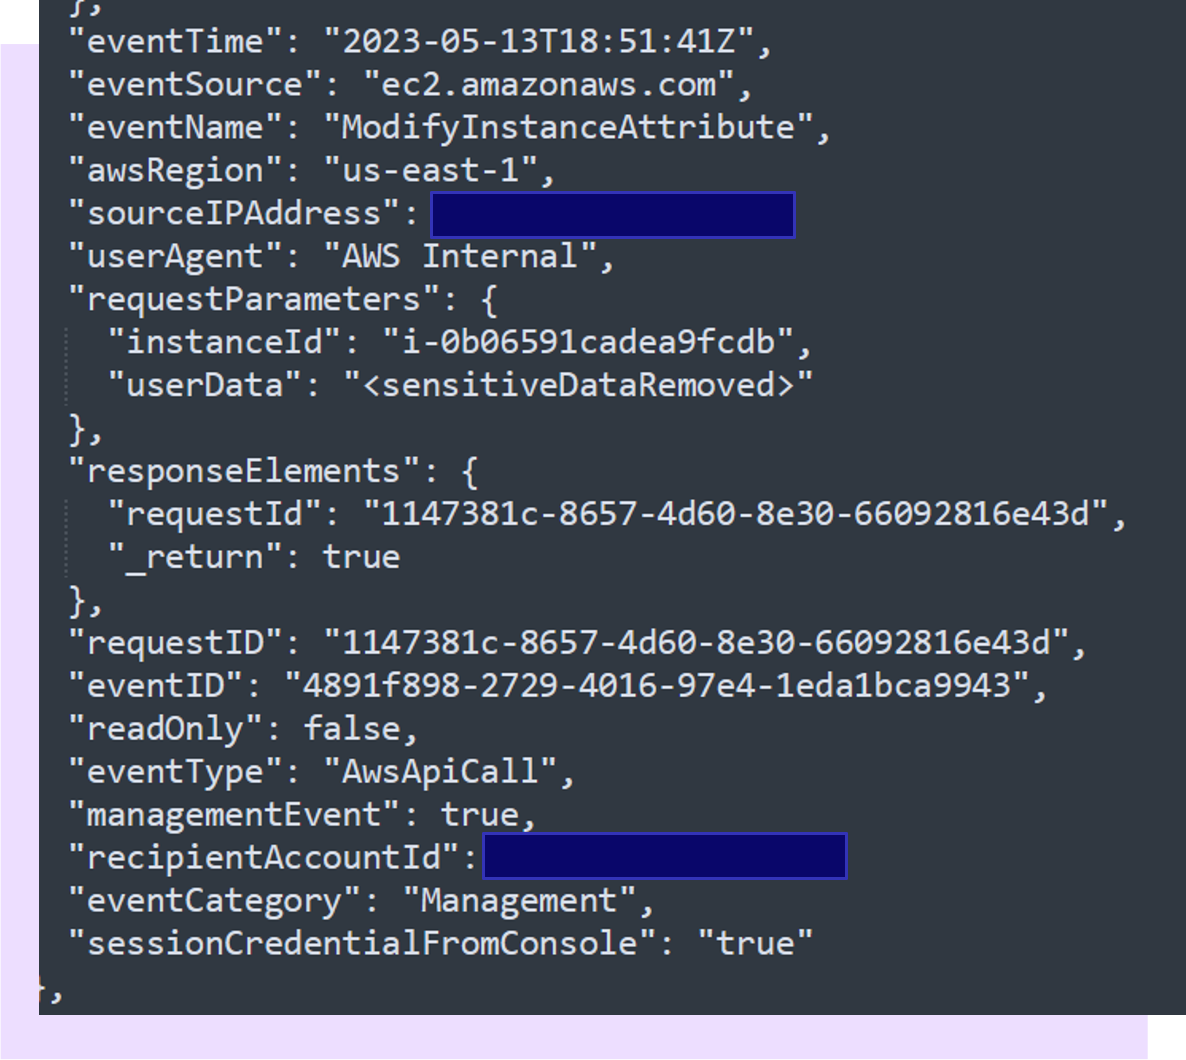
So an analyst’s first step would be to run a command to pull this data.

However, ran than rely on an analyst to have all the necessary permissions and access, the better solution is to fold these capabilities into your detection platform and automatically run this command when the alert fires and appropriately enrich your alert. Thus, you have a more secure and faster system that allows your responders to do their analysis in a timely and efficient way.
Generation
This may be the most common integration that detection engineers will support in their environment. Let’s say you use a Cloud Detection and Response tool. While a basic implementation may involve directly sending alerts to your case management system, a mature DaC team will ingest those alerts into their SIEM just like any other data. From there, alerts can be normalized, suppressed, and enriched as appropriate.
Maturity Levels
- Ad hoc: No or minimal integrations
- Structured: Some integrations setup, but setting up new integrations is high effort. Missing tooling and standards
- Automated: Process and tooling exists for developing new integrations, can automation suppression or enrichment for key detections
- Optimized: Integrations for suppression and enrichment. Can easily incorporate 3rd party alerts. Strong standards and tooling for deployment of new integrations
Monitoring
As our systems grow in complexity, it becomes increasingly important to monitor their inputs, activity, and outputs. Identifying and resolving failures or errors in your system as quickly as possible is the goal. I generally break down monitoring into 3 parts: inputs, executions, and outputs. Are you getting good data? Are you monitoring the performance or run time failures in your system? Are you generating useful alerts?
Inputs
Data quality can be (and has been many times from other writers) its own blog post. For the purpose of detection engineering, I focus on five areas of data quality:
- Format or ensuring your data is well structured and parsable (please stop using syslog)
- Volume or monitoring for spikes or drops in data volume
- Completeness or ensuring you’re collecting data from all systems or accounts
- Timing or ensuring that data is reaching your detection engine soon after the event occurs
- Data contracts or your ability to work with system owners to ensure they improve their system in a timely manner if any area of data quality drops
Execution
Monitoring the runtime of your system can further be broken down into two main categories.
Performance/Cost
Are you watching for spikes in cost or drops in performance? Do you find out about an issue when you get the bill or have you setup monitoring to rapidly alert to cost spikes?
Failure Handling
This has large overlap with business continuity and disaster recovery and will make your compliance team happy. When a rule fails, does your system identify this and re-run it automatically? Do you get alerted when it repeatedly happens so you can take action? Or do things silently fail? If you wrote all these great detections but something is silently failing, then you’re not executing an effective detection engineering system.
Outputs
This is the area of monitoring that most security operations are familiar with and start off with: labeling your alerts as true or false positive and working to improve the false positives. As you mature, you can grow in this area with improved labeling or proactively suppress alerts that start spiking and overwhelming your triage team. As an example, at Snowflake, we’ll quarantine a particular detector and create a ticket for our detection engineers if it has too many false positive closure statuses within a particular time window.
Maturity Levels
- Ad hoc: Find out about missing data during forensics, get told about detection issues from the SOC
- Structured: Collecting output metrics, basic dashboards and visualizations
- Automated: Notified about failures, established SLAs and SLOs
- Optimized: Automated suppressions, data/performance contracts, automatic recovery capabilities
Maturity Matrix
| Language | Testing | Integration | Monitoring | |
|---|---|---|---|---|
| Ad Hoc | Markup language | No or minimal testing | No or minimal integrations | Find out about missing data during forensics, get told about detection issues from the SOC |
| Structured | Query language | Some testing in all areas or strong testing in some areas but missing in others | Some integrations setup, but setting up new integrations is high effort. Missing tooling and standards | Collecting output metrics, basic dashboards and visualizations |
| Automated | General-purpose language | Some testing in all areas with strong capabilities in a few categories. A sandbox/dev environment exists and is used | Process and tooling exists for developing new integrations, can automation suppression or enrichment for key detections | Notified about failures, established SLAs and SLOs |
| Optimized | Any combination of the above/best tool for the job | Appropriate testing for all components with code coverage measurements. Tests required for new detections, with appropriate mechanisms in place (ie. robust criteria and automated expiration) for break-glass scenarios | Integrations for suppression and enrichment. Can easily incorporate 3rd party alerts. Strong standards and tooling for deployment of new integrations | Automated suppressions, data/performance contracts, automatic recovery capabilities |
Setting Goals
You may read through this blog post and wonder how you’ll ever reach optimized in all categories. It’s my belief that this shouldn’t be the goal for all teams. Security is ultimately a function of risk management, and you shouldn’t overinvest for how much risk you mitigate. Similar, with adopting devops principles your detections, you may end up over-engineering when resources could have been better invested in other areas. As an example, if you’re a smaller shop where your only detection engineer also runs vulnerability management and incident response, then shooting for optimized across the board may not be realistic. In that case, it may be more important that you have strong integrations and automation to scale your engineer. Meanwhile, a shop that has a ton of legacy components may want to invest in monitoring to ensure all areas are working as expected. Reason through your particular situation and where your pain points to decide where on the matrix you want to end up before setting unreachable goals.
Conclusion
Detection as Code (DaC) represents a significant advancement in cybersecurity, bringing software engineering principles into threat detection processes. By breaking DaC down into functional areas—programming language, testing, integration & automation, and monitoring, we can assess our current maturity and pinpoint areas for improvement.
Each functional area offers a pathway from basic, ad hoc practices to optimized, comprehensive systems that enhance efficiency, reliability, and response times. Implementing DaC requires a commitment to continuous improvement, leveraging the best tools and practices available.
As cybersecurity threats continue to evolve, adopting DaC can provide a robust framework for staying ahead. By treating detection rules as code, integrating rigorous testing, and ensuring seamless automation and monitoring, we can significantly enhance our security posture.
Whether your team is just starting out with DaC or looking to optimize an existing system, focusing on these key areas will help you build a more resilient and responsive security operation. The journey to maturity in DaC is incremental, but the benefits—reduced response times, fewer errors, and more effective threat detection—are well worth the investment.
(Note, this is a blog post version of a talk I gave a while ago with some additional updates. You can find the original slides here.)